
If you need urgent consulting help click here
Debugging your application
You can debug your application inside a simulation by simply starting up the debugserver inside the simulation monitor window:
(machine-0) machine StartGdbServer 3333
You can then do debugging using any IDE that supports a remote debugger connection (since you are simulating, it has to be remote - the process is the same as for debugging application over JTAG).
Personally I use GDB dashboard (https://github.com/cyrus-and/gdb-dashboard) which gives me full functionality of GDB but also with a python prompt.
You can start debugging on any testbench regardless of whether it’s app testbench, board testbench or custom testbench. The commands are created for you and are suffixed with debugserver suffix:
west build -b boardbench_debugserver
This launches the board testbench and starts a gdb server as well.
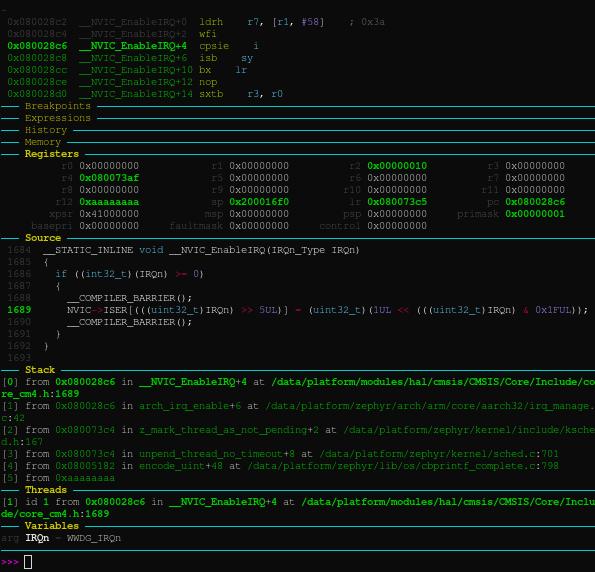
You can now debug the application using gdb dashboard. The dashboard is accessible through “debug” alias command inside the docker image. It accepts the same arguments as gdb, but also loads the graphical interface which makes debugging easier:
debug build/zephyr/zephyr.elf
Once you are inside gdb, you need to tell it which running instance to debug. Since we have a gdb server running inside the simulator, we can connect to it like this:
(gdb) target remote :3333
Renode commands are now accessible from GDB using the “monitor” command (or “mon” for short):
To get help on the available commands you can type:
(gdb) mon help